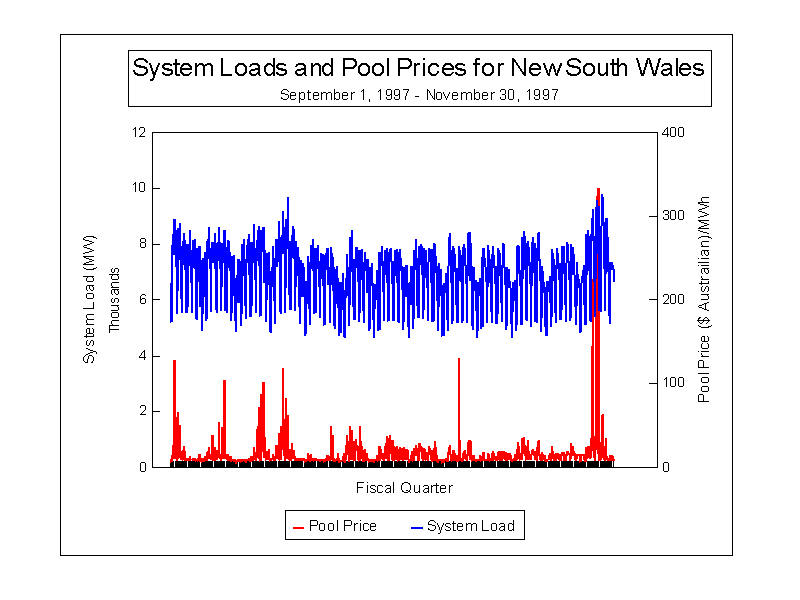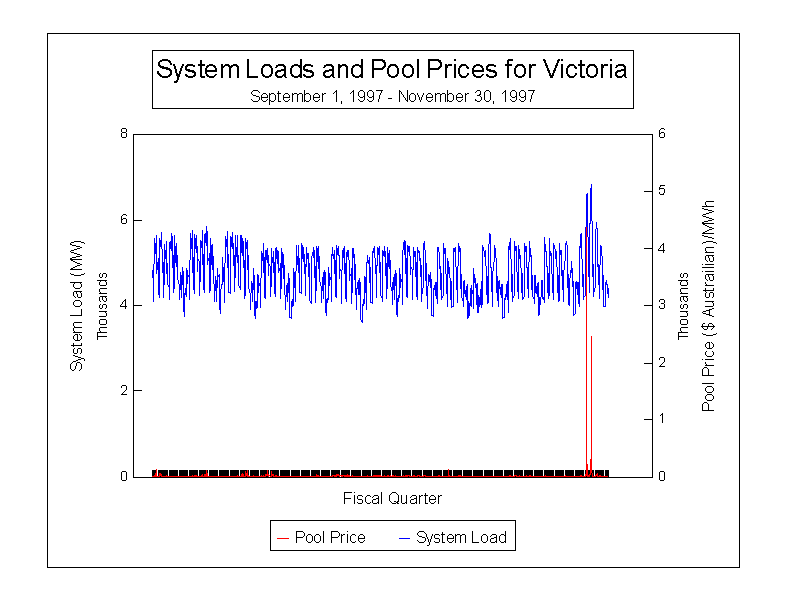
These graphs illustrate the price volatility that has occured in the Australian Electricity markets. We at IREMM have been drawing heavily on the behaviour of these foreign markets to make a case that buyers should protect themselves against dramatic upward price volatility.
The following graph illustrates the loads experienced by the New South Wales region in blue and the prevailing pool prices in red. The price volatility is clearly visible in these graphs and the upward limit on prices is $5000.00 / MWh (Australian $). During this period, prices did not climb over $350/MW, but they could have.

This next graph illustrates the loads experienced by the Victoria region in blue and the prevailing pool prices in red. Again price volatility is clearly visible and the upward limit of $5000.00 / MWh (Australian $) was reached during this period. Once tight market conditions appear, pricing logic leave the realm of supply and demand fundamentals and enters the realm of emotional pricing where the panic level in a buyers voice is the key determinant in price setting.

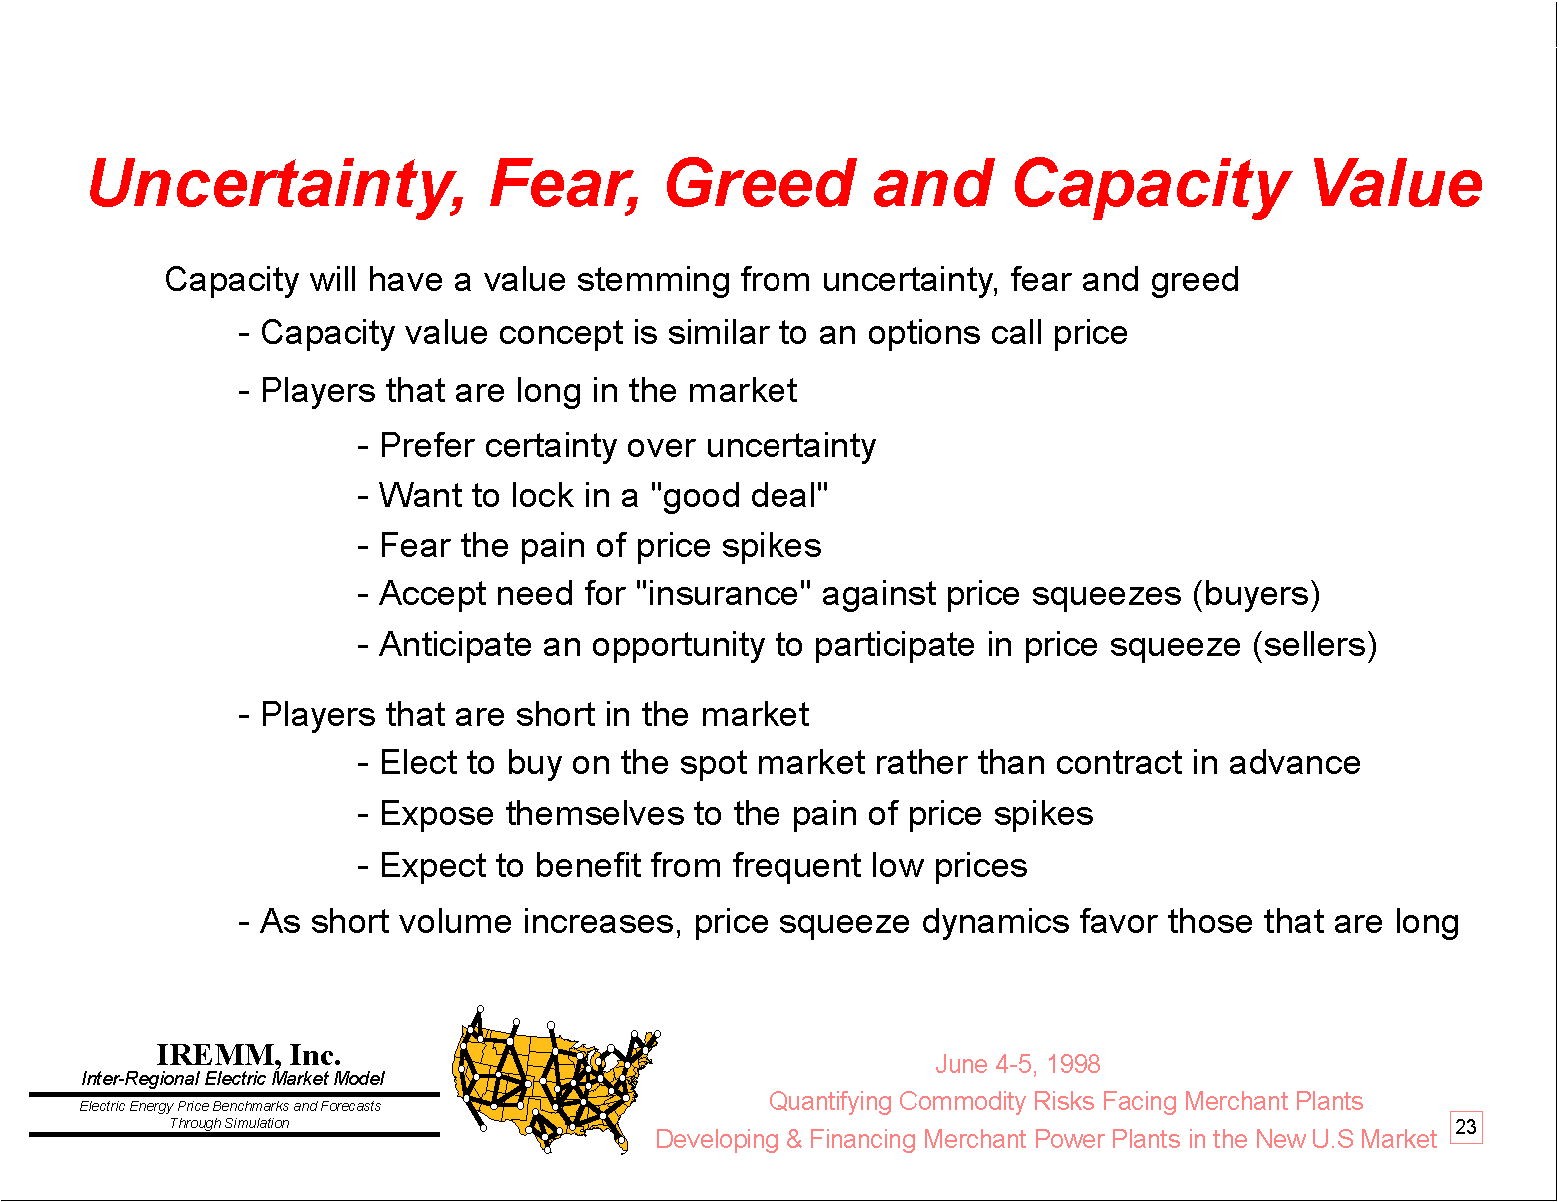
New reserve capacity will be built precisely because the pain of such price spikes makes buyers willing to ensure that they have sufficient resources to meet their obligations. Conversely, from a firm power sellers perspective it is the pain of these spikes during a unit outage or contract interruption that makes the supplier aquire reserve capacity. It is partly the risk of these $5000/MWh price spikes, and the resulting taxpayer liability, that is causing the government of South Australian to divest itself of their generating assets.

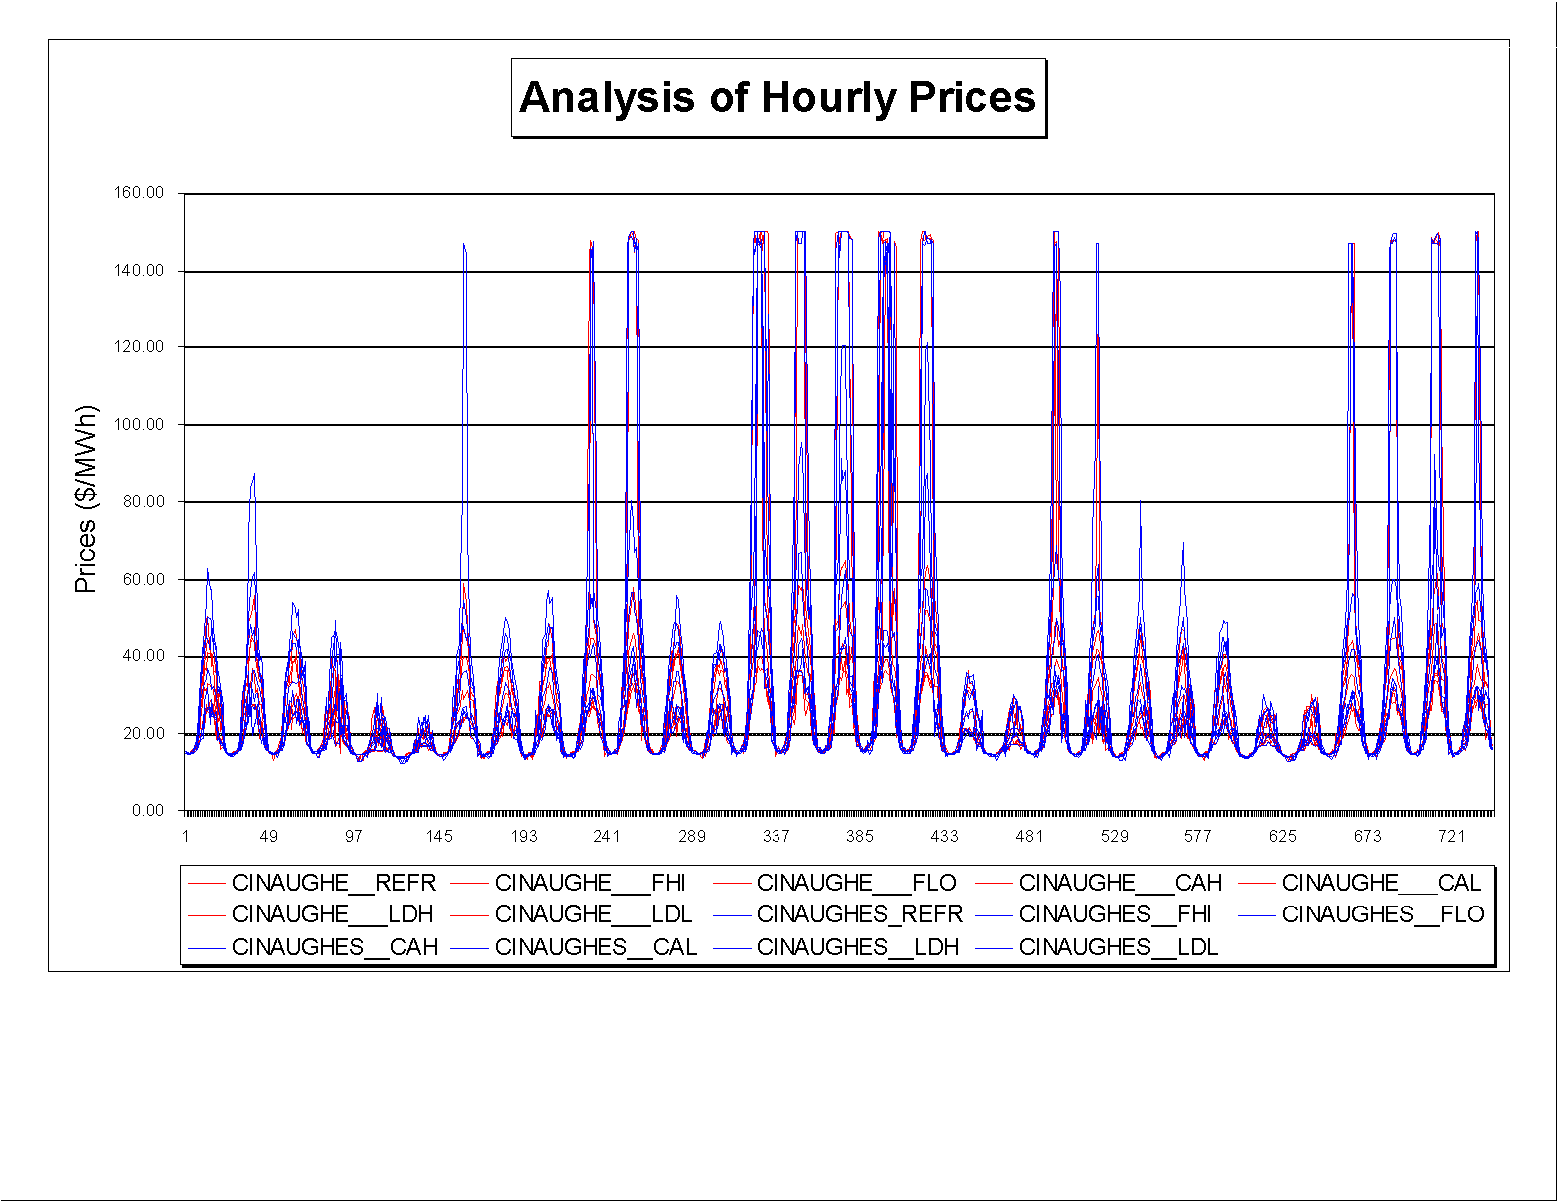
It has been the position at IREMM that these price spikes will occur in the U.S. Markets and the following is a sample of the results for CINERGY from the standard IREMM Ecomony Energy Outlook cases:
No Price Squeezing Filter
1. Base Case
2. High and Low Oil and Gas Prices
3. High and Low generating unit availaility
4. Severe and Mild weather
With Price Squeezing Filter
5. Base Case
6. High and Low Oil and Gas Prices
7. High and Low generating unit availaility
8. Severe and Mild weather
Once the prices reach the $150/MWh level, a price squeeze is considered likely and emotional pricing is the natural outcome. The use of the IREMM Power Risk Calculator by retainer clients of IREMM and ESAI would allow bulk power market price risk to be quantified, better understood and help anticipate price squeeze events.

For further information, contact either IREMM or ESAI at the following e-mail addresses.