Inquiry Concerning the Commissions
Policy on the use of Computer Docket No. PL98-6-000
Models in Merger Analysis
Response to
Request for Written Comment and
Intent to Convene a Technical Conference
Provided by
Wayne Coste and Gail Adams
IREMM, Inc.
6 White Water Turn
Tariffville, CT 06081-9649
(860) 651-1600 (Phone)
(860) 651-1600 (FAX)
iremm@iremm.com
IREMM, Inc. was founded in 1994 to serve the electric power industry and bulk power market participants. IREMM provides analytical tools to the electric power industry for forecasting the market price of electricity and valuing generating assets. Our primary corporate focus is on licensing the IREMM model to forward-looking clients, and working with them to develop a strategic understanding of energy markets. A key aspect of this strategic understanding is the ability to analyze what is frequently referred to as "market power." Because we are on the forefront of this type of analysis, we have elected to respond to your requests for comments. Additionally, we are willing to participate in a technical conference on this topic.
Based on the background information provided, the model that we have been developing over the last decade seems ideally suited to address the questions posed in the FERC’s request. IREMM is a hybrid model that encompasses both generation and PTDF transmission representations. The IREMM model does not attempt to model either the generation system or the transmission system in minute detail. We believe that some level of detail is necessary in order to analyze the electric power infrastructure during a merger proceeding. However, it is important to keep the larger issue of market dynamics in view, and to avoid becoming mired in too much detail. Analytical tools honed to perfection in a regulated world, and designed to cater to the regulatory compact, are inadequate for understanding deregulated markets. We believe that market analysis can become incredibly bogged down if detailed tools with little lack analytical breadth are used.
For example, a major problem with the commercially available detailed production-costing models is their singular focus on the production cost of a fleet of generating units. These models are designed to analyze production costs with many decimal places of precision. Using detailed engineering assumptions, they develop cost-based market prices. Bidding and pricing behavior observed in a competitive market render the benefits of such details superfluous. It is the hypothesis of the proposed technical conference that bidding strategies will not be cost-based, and that this necessitates an analysis of market power.
Furthermore, we believe that highly detailed transmission models are inadequate for market power analysis. Such tools might be able to indicate the potential for opportunistic pricing in load pockets from time to time, but they are clearly unsatisfactory for application to the broader merger policy issues that need to be addressed in a horizontal market power screen. Some people in the regulatory community view the transmission system as much more complex than any other system that they have considered in previous analyses of competitive markets. They argue that because a generator can affect others’ transmission capability, it is necessary to use a "richly textured model" for market power analysis. We suggest that these operational issues can and should be handled by an independent system operator. The following analogy is comparable to applying detailed transmission models to market power analysis in the case of a department store:
A key question, discussed further in our response, is whether horizontal market power of generation should be a significant issue at all in a competitive bulk power market. The issue of market power probably should remain focused on two issues: 1) the free, fair and non-discriminatory transmission access policies already being advanced within FERC, and 2) institutional barriers to new merchant entrants at both the federal and state levels. We assume that markets generally work. Opportunities to exert market power and collect rents in excess of prices determined in a competitive market provide incentives for new competitors to enter the market. The increased supply, or even the threat of increased supply, will keep prices down to competitive levels.
A key concept underlying our perspective is that sophisticated middlemen will purchase from various generating resources throughout the Eastern or Western Interconnected Systems, and resell them to 1) distribution companies; 2) customers who elect to by-pass the local distribution company; 3) industrial customers; and 4) other middlemen with whom they compete. We do not expect that many residential customers will call up the neighboring power plant and ask for a few kWhs per month. Rather, these customers will have the opportunity to select from many competing middlemen based on the best combination of price and service. Price discipline is imposed by the dynamic interaction between many sophisticated large generating companies and many middlemen using the threat of new merchant generation.
Competitive Analysis Screen
The analytic screen is intended to provide a standard method and the data assumptions necessary to enable the Commission to determine quickly if a merger poses market power concerns. The five Department of Justice concerns for mergers are:
1) Increased market concentration;
2) Adverse competitive effects;
3) The possibility of mitigation by new market entrants;
4) Efficiency gains not available through other means; and
5) Potential failure of a company absent the merger.
The focus of a model should be directed toward items 1 and 2. Item 3, related to new market entrants, cannot be adequately modeled because many state and local issues which could create insurmountable barriers to new market entrants need to be considered . Ultimately, it is the ability (or even the viable threat) to bring new merchant plants into a market that provides price discipline. The last two items are beyond the scope of a model and information must be obtained from other sources.
Many issues surrounding increased market concentration and adverse competitive effects can be addressed with the help of a model. These issues include geographic market boundaries and delivered price tests. The examples shown in section IV illustrate how a model can be used to analyze the delivered price criterion.
Most of our comments derive from insights gleaned from analyzing bulk power markets with the Inter-Regional Electric Market Model (IREMM Model). Thus, this model and its analytical framework are referenced frequently in our comments.
FERC’s request for comments is directed toward the horizontal market power of large generating companies that could potentially manipulate prices. The possibility of merger raises another issue not addressed here: Can transmission ownership be manipulated to favor the merged company’s generating business units over its competitors?
Issues/Questions for a Technical Conference
We are pleased to provide the following comments, which are directed toward the specific questions asked on pages 22 to 26 of the Request for Written Comments:
I. Basic Model Structure
The use of historic economic market data, such as reported system lambda, should be avoided in the context of a horizontal market power screen because this statistic is highly focused on the cost of marginal generation in a regulated context. In the context of a deregulated bulk power market the issues will be how will company pricing behavior deviate from cost based regulated concepts. It does not seem either informative or useful to include a comparison to a regulatory artifact such as system lambda in a delivered price test. Simulation of the entire market and the interplay dynamics between market participants is the most informative.
2) Q. ... would another mathematical programming form be better ... There are many ways to look at this issue. We would recommend using a monthly model that subdivides the monthly load duration curve into three segments, on-peak, mid-peak and off-peak. This process provides 36 periods per year for testing market power issues. Implicit in this approach are assumptions of load diversity/load correlation throughout the interconnected region. If the monthly analysis does not provide sufficient resolution, FORM 714 information can be used to create hourly load models.
3) Q. ... Should demand be responsive to price ... This issue is interesting. It is possible to model DSM (price sensitive loads) as supply side resources that can be handled as dispatchable resources. We cannot provide guidance on the values of price elasticities which would be appropriate or how an objective function such as the maximization of social welfare should be included.
4) Q. ... rely on transmission factors supplied by others. Until there general acceptance on the NERC PTDF numbers, FERC may find it necessary to develop its own set of PTDF. We do not have much experience with working with the current NERC PTDFs and they currently are incomplete as there are no New England or Western PTDFs.
5) Q. Is a formulation with a constant variable cost sufficient for purposes of a screening model. This representation appears reasonable, given the fact that the bidding strategies that comprise the core of this analysis will outweigh the benefits of multi-block heat rate representation. Additionally, to implement multi-block heat rates properly pre-supposes the existence of non-trivial unit commitment logic. The resulting model would be much more cumbersome, with minimal improvement in market power analysis.
6) Q. How should generation unit availability and losses be handled. Scheduled and forced outages should be represented separately. These data are easily and adequately represented by NERC availability statistics, which are broken down by technology, fuel and unit size. Transmission losses can be ignored because they rarely exceed a few percent, and should have little meaning in the context of a horizontal market power screen.
7) Q. How should generation and transmission reserve requirements be modeled. Generation operating reserves could be modeled as an increase in loads. Alternatively, operating reserves could be ignored because an ISO is able to sell out of its spinning and operating reserves in the event of "tight" market conditions. This ability could help mitigate market power, depending on the rules for selling out of operating reserves in price squeezing cases. Transmission reserves are relevant only in the context of transmission constraints. Transmission reserves might be represented via lower transmission constraint limits.
The concept of generation reserve margins in the context of a horizontal market power analysis is almost a bizarre concept. The critical market power issues surrounding future resource additions concern ownership and bidding price behavior. In a competitive market, it is unlikely that the new resources will be built, operated, or controlled by the merged entity. If the new expansion resources are operated by another entity would tend to dilute any market power of the merged entity.
8) Q. Are there other operating concerns that would need to be represented ... Detailed operational issues such as incremental heat rates, start-up costs, ramp rates are nearly meaningless in horizontal market power analysis. Bidding strategies in the context of a competitive de-regulated bulk power market will not be cost based, and the added precision gained by incorporating these factors will be rendered superfluous by the actual market bidding strategies used in the marketplace.
II. Alternative Implementation of Basic Model
The analyses illustrated in section IV were performed in a single afternoon using the IREMM Model. A task typically performed during a standard two-day IREMM training session is a market power evaluation. Therefore, applicants would have the ability to perform a market power study with a standard commercially available model (IREMM) and data base, following the concepts described in section IV.
2) Q. ... As [wheeling] rate structures change and power pools evolve ... The IREMM Model can reflect various wheeling rates between market areas (control areas). There are four ways to represent wheeling rates in the IREMM model. While other approaches may exist, they probably would be minor improvements over those currently used:
2) Each market area is assigned a unique wheeling rate. The wheeling cost between two market areas is related to the lowest cost path, and not the shortest path;
3) A fully defined wheeling rate matrix can be read in (e.g. MW-mile based);
4) An ISO-based wheeling rate can be defined for each ISO that can assign fixed wheeling rates for transactions between members, separate export fees for sales to the outside world, and import fees for purchases from the outside world by members of the ISO.
3) Q. How should firm sales and contracts be represented ... Reassigning capacity due to joint ownership and contracts is probably not very important. It is more important to make sure that all of the capacity is included in the case. It is less important to identify who is in control of bidding strategies of these contracts. Long term capacity contract entitlements are not very relevant in short term markets because within the vibrant bulk power markets that have developed there are many, many, many reassignments (purchases and sales) of capacity that occur over the course of a month ahead, a week ahead, a day ahead and an hour ahead. This continuous reassignment of capacity by purchases and sales within the market renders the effect of long term capacity commitments almost irrelevant.
4) Q. Should the overall area be broad, for example, the Eastern Interconnected System ... It is our recommendation that the entire market must be represented in order to include all of the generating company’s potential competitors and opportunities to sell. When looking at the market power of a merged company, it is important that purchases and sales of energy can be considered between all of the companies in the Eastern Interconnected system. Restricting the size of the market included in the analysis overstates the market power of a merged entity. Additionally, the FERC should be prepared for the day when merged entities will have operations throughout the entire Eastern and/or Western Interconnected System.
5) Q. Should different modeling structures be used ... for different regions. The Eastern Interconnected system and the Western Interconnected system each have their own characteristics, and these can be reflected in the infrastructure data used in the model. The model itself is applicable to any region.
III. Data Issues
The preferred source of data for a market power analysis is a database product developed by Resource Data International (RDI) called BASECASEtm. This comprehensive database contains information on virtually all of the generators in the United States, Canada and northern Mexico, and the data are obtained through publicly available sources. RDI provides the data in the format compatible with the IREMM Model, for quick input for market power analysis. This BASECASEtm data source provides an unbiased reference for any applicant to develop market power analyses. It is highly likely that an applicant requesting consideration to FERC for a merger is a subscriber to RDI’s BASECASEtm database.
2) Q. What are the best sources for estimating the fuel cost component ... The best source of coal price data comes from the FERC Form 423 data. This information is not useful for oil and gas prices because of sampling problems (eg. gas was only burned for 2 days last October when, for local transmission consideration, it was made available at $1.31/MBtu), and the volatility in the price of oil and gas commodities. Oil and gas prices are available from a variety of sources, including the DOE Annual Energy Outlook. Heat rate information can be obtained from EIA 860 data and other CEM-derived data. RDI’s BASECASEtm has processed CEM data for better estimates of unit heat rates.
3) Q. Should variable costs include non-fuel operating and maintenance costs? Some estimation of these variable O&M costs should be included. Because of the "art" with which each company develops them, and because there is no agreement as to what they should be, we have adopted generic values. If anyone could provide better estimates, they should be used. We recommend that generic values be applied universally to all generating units, by technology and size category.
4) Q. Should NERC’s PTDF and Flowgate limits be used? We have used data similar to the NERC PTDF values in the IREMM Model. It seems reasonable that the use of a revised set of PTDF could adequately represent the critical flows in a transmission system. The current format of the iIDC on the NERC web site is too cumbersome to use, but if the data were made available in other formats, they could be incorporated easily into the IREMM Model. The current complement of 1400 flowgate elements in the PTDF database is probably too large for a horizontal market power screen and should probably be reduced to 20-30 key transmission interfaces.
5) Q. If NERC flowgate limits are unavailable ... The PTDFs should still be used. The broad interfaces that affect energy trades can be quantified using the interface limits published in the NERC summer and winter transmission assessments.
6) Q. Environmental factors can influence the variable cost of operating plants ... Environmental factors are important and should be considered in the operating cost of generators. The IREMM Model can accommodate SO2, NOx and CO2 allowance values, which provide important sensitivities. The NOx emission rates can be applied by state and for specific months in a year, to reflect the application of allowance values only during the "ozone" season.
IV. Application to Merger Issues
A computer model such as the IREMM Model can be used to address horizontal market power issues by analyzing the incentives for market participants to behave in certain ways. The approach illustrated in these examples is a step beyond the simplified delivered price test, and quantifies the very issues that are at the heart of the delivered price test.
For these comments, market power is defined as the ability of a company successfully to demand higher prices for its products, consequently increasing its profits, even though it may sell substantially less. No attempt is made either to reconcile this behavior with an existing legal standard or to propose the criteria that a standard for market power should incorporate. Rather, these comments, and the examples included in the text, illustrate the feasibility of a computer model to address the issues of concern in a merger analysis.
In a deregulated bulk power market generating companies will be forced to live off of what they can hunt down and eat, they will develop pricing strategies that fundamentally are different from those seen in the bulk power market today. In today’s bulk power market, utilities are willing to sell at prices just above variable costs. They are willing to do so for two reasons:
2) Making something is better than making nothing at all.
In the future, when a generating company no longer has jurisdictional customers, it will need to develop a different pricing strategy because all of its actions will have some impact on revenues, and consequently, on their profits. A way to anticipate emerging pricing strategies is to evaluate how a large generation owner will attempt to maximize its profits.
IV.a. The Whopper question of Market Power Criteria
The following question forms the basis for further discussions on the behavior of large market participants and the concept of market power. This Whopper question about market pricing must be answered before establishing the criteria suitable for use in a horizontal market power screen:
Underlying the analysis of horizontal market power is the following question: What type of behavior is expected by a market participant, and when should this behavior be viewed as abusive. Many analysts cite the ability of a market participant to withhold energy, demand higher prices, influence market prices, and increase profits as proof of market power. The following example illustrates the Whopper question of horizontal market power criteria that we believe must be resolved.
Many businesses are able to influence market prices by withholding products from the market until they can get a higher target price, or by cutting prices to gain market share. We observe these practices in our daily lives. For example, Burger King can drive down hamburger prices of its competitors by offering a $0.99 Whopper, or it can remove downward pressure on prices by selling Whoppers for $2.59. Other hamburger merchants and customers have incentives to respond to these changes in the marketplace. In either case, a single market participant could push prices higher or lower, even though it may not be perceived to have market power in a legal sense. In the following discussion on market power, the reader is advised to reconcile his/her reactions to the parallel Whopper questions "Can Burger King be viewed as withholding a hamburger (that costs $.38 for the meat, ketchup, buns, cooking heat etc.) from the market until it gets its target price ($2.59); Should the capacity factor of the broiler oven be an issue to anybody except the restaurant manager; Who should set the price of a Whopper? Do barriers to entry exist to prevent another hamburger merchant from entering the market?
VI.b. Applications to off-system sales into the bulk power market
The following example shows how a computer model can be used to evaluate the market power of a company competing in the bulk power market. This example be equivalent to testing, in 10 cent minimum profit before sale increments, at what price Burger King would maximize its profits by selling Whoppers at prices of $0.38, $0.48, $0.58, ... , $2.58 each. In this example a large company will test a strategy of using different minimum profit margins before it will sell into the bulk power market. This example focuses on sales into the wholesale spot market only. The different strategies do not affect prices paid by jurisdictional customers, who are assumed to pay regulated retail rates. If these pricing strategies were to influence not only the sales in the bulk power market, but the 100,000 GWh of jurisdictional customer loads, the incentives would be amplified accordingly.
Under the current regulatory paradigm, existing jurisdictional customers continue to pay most of the fixed costs of an electric company, and profits on external sales may be considered "gravy." Under these circumstances, "earning something is better than earning nothing," and offering energy to the bulk power market at cost and collecting the market clearing price is a reasonable strategy. In this case the minimum profit before sale criterion is $0.00/MWh above dispatch cost.
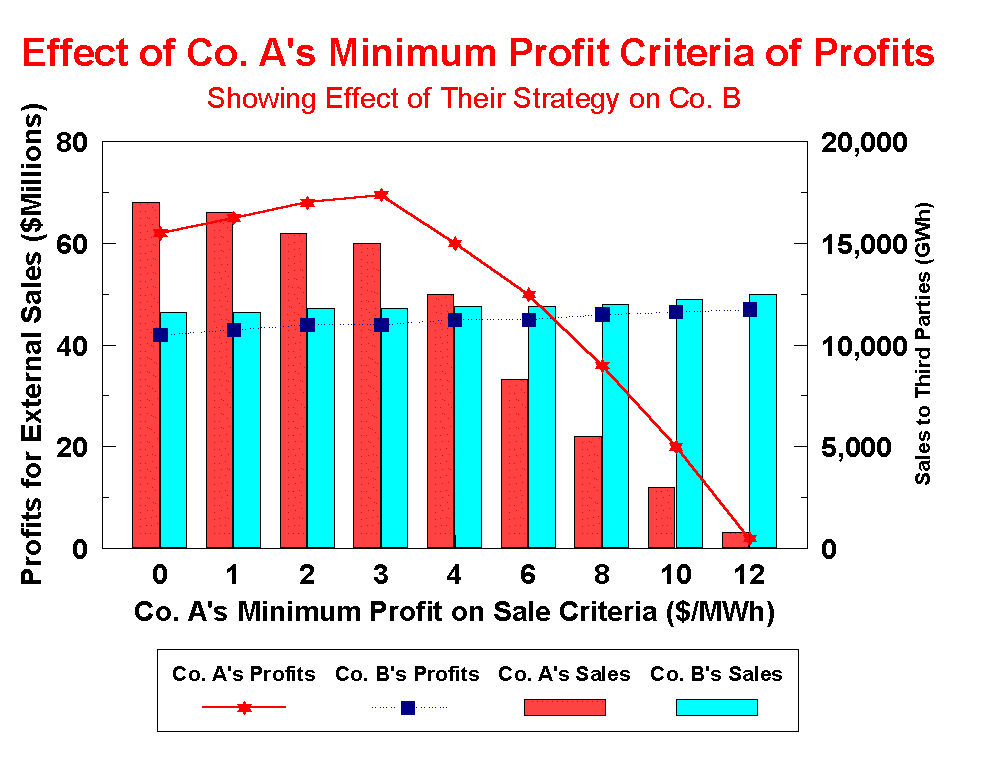
In the example shown in Figure 1, the minimum profit before sale criterion is varied from $0.00 to $12.00/MWh. At the $0.00/MWh minimum profit before sale criterion, Company A bids into the bulk power market at cost. It sells 17500 GWh and earns $62 million in profits on off system sales in the 36 time periods (twelve months for on-peak, mid-peak and off-peak). If Company A adopts a $1.00/MWh minimum profit before sale criterion, it loses some sales, but it is able to push prices up slightly, and its overall profit will increase to $63 million. At a $2.00/MWh minimum profit before sale criterion, it loses more sales, but it is able to push prices up slightly, and its overall profits increase further to $64 million. The trend continues with a $3.00/MWh minimum profit before sale criterion. At a $4.00/MWh minimum profit before sale criterion, it loses sales faster than its profit margins per MWh increases, and its overall profits decrease. At a $12.00/MWh minimum profit before sale criterion, it sells very little, and makes correspondingly little in the bulk power market.
Revisiting the Whopper question: At what minimum profit before sale criterion should Company A be willing to sell its energy? Is its ability to make higher profits even though it is selling less irrefutable evidence of market power? Should Burger King be required to sell Whoppers down as low as $0.38 each?
The market implications for competitors is evidenced by Company B. As Company A withholds and seeks higher prices, Company B’s sales and profits increase as it benefits from Company A’s strategy. It is assumed that all of the other market participants, except Company A, follow a $1.00/MWh minimum profit before sale strategy.

Figure 1: Effect of Company A utilizing different minimum profit before sale criteria
If Company B were to adopt a strategy identical to that used by Company A, and were to implement the minimum profit before sale criteria in lockstep, sales would drop and profits would increase for both. Profit maximization would occur at a higher minimum profit before sale criterion and higher absolute profit levels. This behavior is illustrated in Figure 2, and can be characterized as one of the following:
1. Price leader/ price follower behavior
2. Adoption of similar business strategies,
3. Collusion (probably relevant only if price negotiations are conducted in secret),
4. Merger (a merger can be viewed as officially sanctioned collusion).
Again, one of the landscape issues in this example is that the pricing strategy only affects the quantity sold and the prices received for off-system sales in the bulk power market. If all sales were affected, including the 100,000 GWh of native jurisdictional load, the benefits of withholding would be magnified greatly. In the following example, a large GENCo is examined to observe the effect of market power on the strategy it would have the incentives to implement.
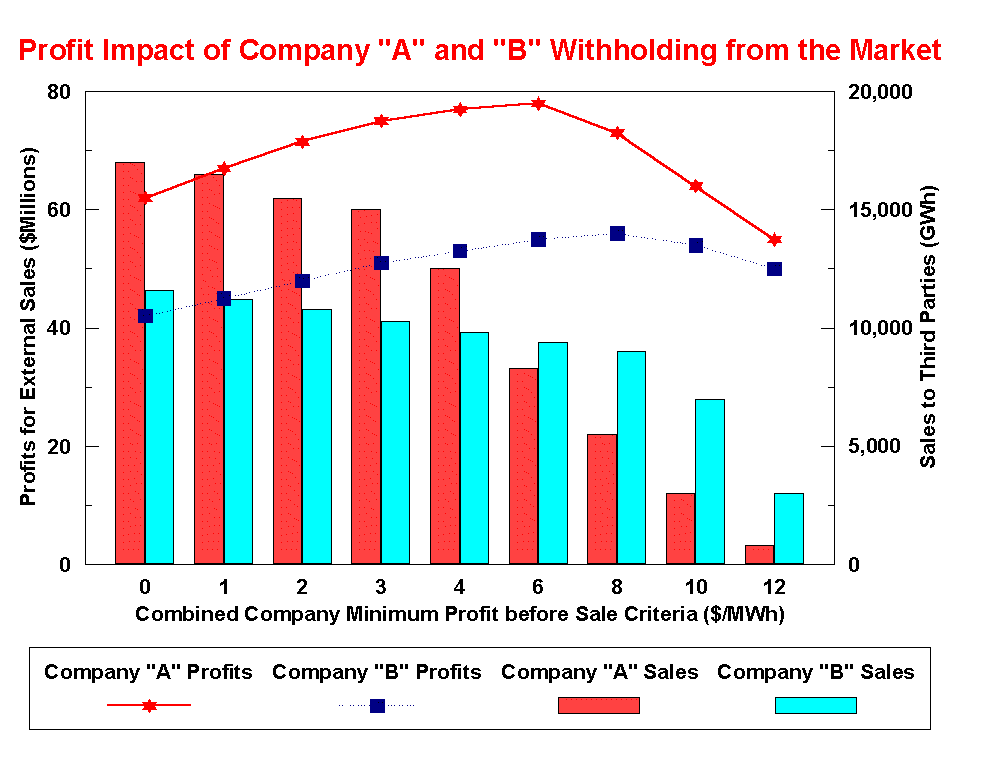
Figure 2: Effect of Company A and Company B both utilizing the same minimum profit before sale criteria
IV.c. Large GENCo Market Power Analysis
In this example, Commonwealth Edison is used to represent a large GENCo. (Note: This example assumes that the Kincaid and Zion Plants are operational and under the control of Commonwealth Edison.)
Currently, many companies are willing to sell energy at prices as low as variable costs, which translates to a zero minimum profit before sale criteria. This willingness does not imply that they receive prices only equal to variable costs when they make the sales -- they get the market clearing price for all of their sales. However, this criterion indicates that they are willing to sell at a tiny profit on the off-system sales. Under the current regulatory paradigm, utilities are required to dispatch their units in the most economic order in exchange for fixed cost recovery -- and regulators may penalize them if they don’t. Therefore, they usually have only a relatively small amount of surplus energy to which they can apply different pricing strategies.
In the future, when a generating company no longer has either jurisdictional customers or regulators insisting on the minimum variable cost dispatch, it will need to develop a different pricing strategy that will reflect the likelihood that all of its sales may affect the prices paid for energy from all of its generation.
To evaluate the yield maximization strategy of a CECo GENCo, the minimum profit before sale criterion was changed from $ 0.00 to $12.00. Figure 3 shows that if a CECo GENCo were to apply a zero minimum profit before sale criteria, it would sell 89,200 GWh, and make $880 million contribution to fixed costs. If it required $1.00 minimum profit before sale, it would lose about 1800 GWh in sales. Because it would receive higher profit margins for what it sells, total contributions to fixed cost increase to $906 million. In fact, Figure 3 shows that the CECo GENCo would maximize its profits by withholding until it obtains minimum profits before sale of $ 7-8.00/MWh, even though its sales are 13 percent lower than in the zero minimum profit before sale criterion case.
It should be noted that for this analysis, all other companies were assigned a $1.00 minimum profit before sale criterion. To maximize profits, the CECo GENCo would implement the strategy of withholding until it meets the $7.00 minimum profit before sale criterion. These results show that it would not be risking much by implementing this criterion -- unless management is rewarded by the Board of Directors for maximizing GWh sales. The CECo GENCo should pursue the higher minimum profit before sale criterion, hoping that other large GENCos -- such as Ameren, AEP and others, would follow and increase their minimum profit before sale criterion. If other large suppliers followed the CECo lead, profits for CECo would increase beyond those shown here.
The threat of new market entrants limits potential market power when many market participants adopt significant minimum profit before sale criterion. As shown in Figure 3, the contributions to fixed costs for a large single Merchant plant increase from $24 million if CECo were to require a $1.00 minimum to $30 million if the CECo GENCo demanded a $7.00 minimum profit. This example clearly illustrates that a cap on market power can arise from the fear of new market entrants. For new entrants to serve as a cap on market power, it is imperative to allow siting and construction of new merchant plants without significant impediments. Impediments that can keep competitors from building include state and local issues such as permits, licenses, and certificates of public necessity and need.
Figure 4 shows the impact on the prevailing market clearing prices in the MAIN region. In this example, prices rise in response to the Commonwealth Edison GENCo pricing strategy. The increase in terms of a type of delivered price test percentage is also shown. Figure 4 indicates that at the $7.00/MWh minimum profit before sale criteria, prices would have risen approximately 5 percent over a pricing strategy based on fuel cost plus variable O&M plus $0.00/MWh. It is not clear whether this 5 percent increase should be compared to the Department of Justice guidelines because it is necessary for companies to price above variable costs, as illustrated here, or the intermediate and peaking service class of generating units may not earn enough to keep them economically viable and this would subject them to premature retirement. A dearth of these intermediate and peaking units would encourage price spikes on days when the capacity situation tightened.
The amount that a company should be able to charge above variable costs is the Whopper question posed earlier in section IVa. In a hypothetical regulated burger world where hamburger producers were given fixed cost recovery, operation costs, return on equity and jurisdictional boundaries, regulators would insist on the lowest cost hamburger ovens being dispatched before the more costly to operate ovens were used in an effort to minimize total jurisdictional costs. This would lead to some regulatory interest in understanding the $0.38/burger "system lambda" for hamburgers. In a competitive market the pricing strategy of a seller will start with its cost of production and then an adder will be developed by applying different strategies to search for profit maximization. This normal business behavior is reflected in Figures 3 and 4. Because there is a framework for analyzing this type of behavior, as illustrated in the IREMM example, the Whopper question that needs to be addressed is what should be the criterion for market power and excessive concentration?
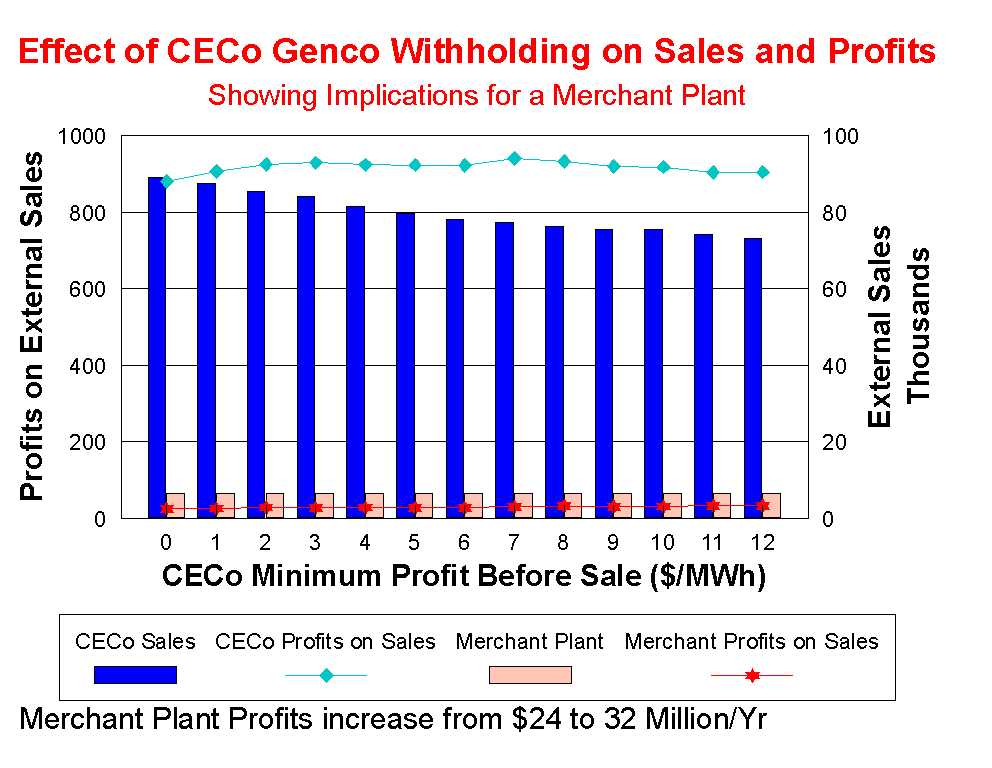
Figure 3: Effect of a Commonwealth Edison GENCo utilizing different minimum profit before sale criteria
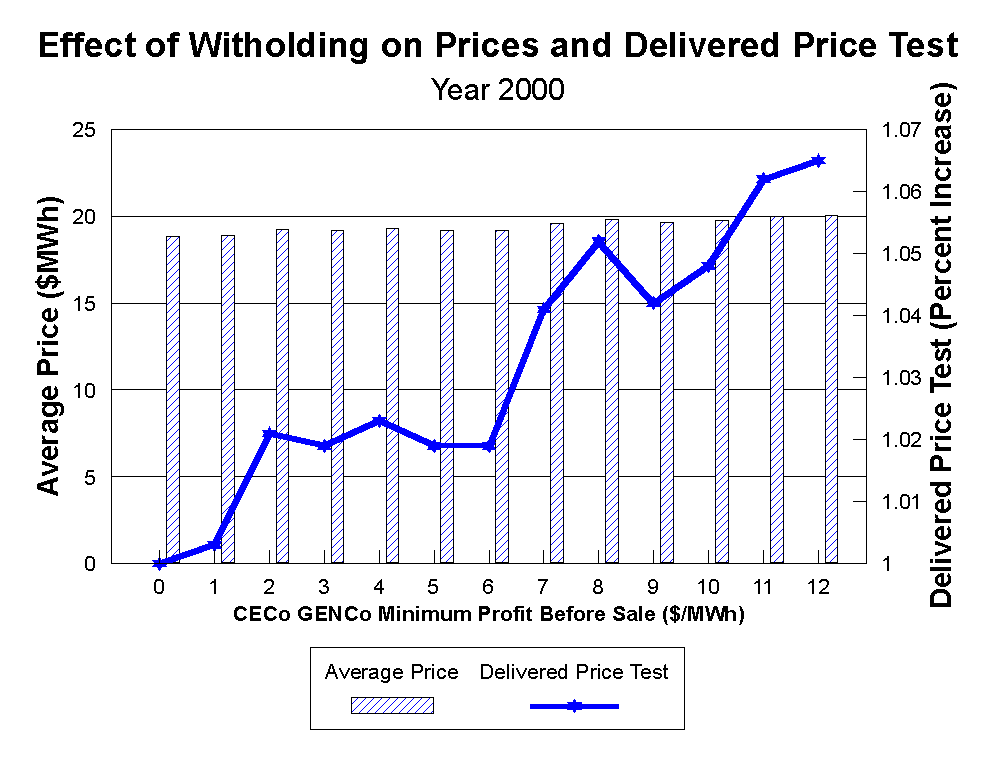
Figure 4: Effect of Pricing Strategy on Average Prices and Delivered Price Test percent increase from a zero minimum profit before sale criteria
IV.d. Effect of Mergers in a Severely Transmission Constrained Area
In the next example, the effect of market power in a severely constrained region is examined. This example was presented at a workshop that preceded the Fourth DOE/NARUC electricity forum in Santa Fe on October 20, 1996. It illustrates not only the market power of a large participant, but the change in incentives under regulation and deregulation. For this analysis, the impact on three ERCOT companies was addressed, with an emphasis on Texas Utilities (TUEC):
CP&L - Central Power and Light which is only 5 percent of the ERCOT Market,
HL&P - Houston Lighting and Power is 25 percent of the ERCOT Market,
TUEC - Texas Utilities is 40 percent of the ERCOT Market.
Under the current regulatory paradigm, utilities are required to dispatch their units in the most economic order in exchange for fixed cost recovery. In fact, the concept of cost minimization has become an end in itself, and regulators penalize companies if they are found to deviate from the mantra of variable cost minimization. Thus, they usually have only a relatively small amount of surplus energy to which they can apply different pricing strategies, and with which to push up prices.
In the future, when a generating company no longer has either jurisdictional customers or regulators insisting on optimized, minimum variable cost dispatch, it will need to develop a different pricing strategy because all of its sales may affect the price paid for energy from all of its generation.
In Figure 5, TUEC is tested at minimum profit before sale criteria as high as $11.00/MWh and as low as $ -3.00/MWh (e.g. willing to lose no more than $3.00/MWh) in a search of greater market share. This does not mean that they receive the bid price when they make a sale -- they get the prevailing market clearing price for all of their sales. However, this criterion indicates their willingness to make energy available for off-system sales. The results show that even a company with 40 percent of the constrained market can maximize profits at only $1.5 million with $0.00- 1.00/MWh minimum profit before sale criteria. Not much market power for such a large market participant!
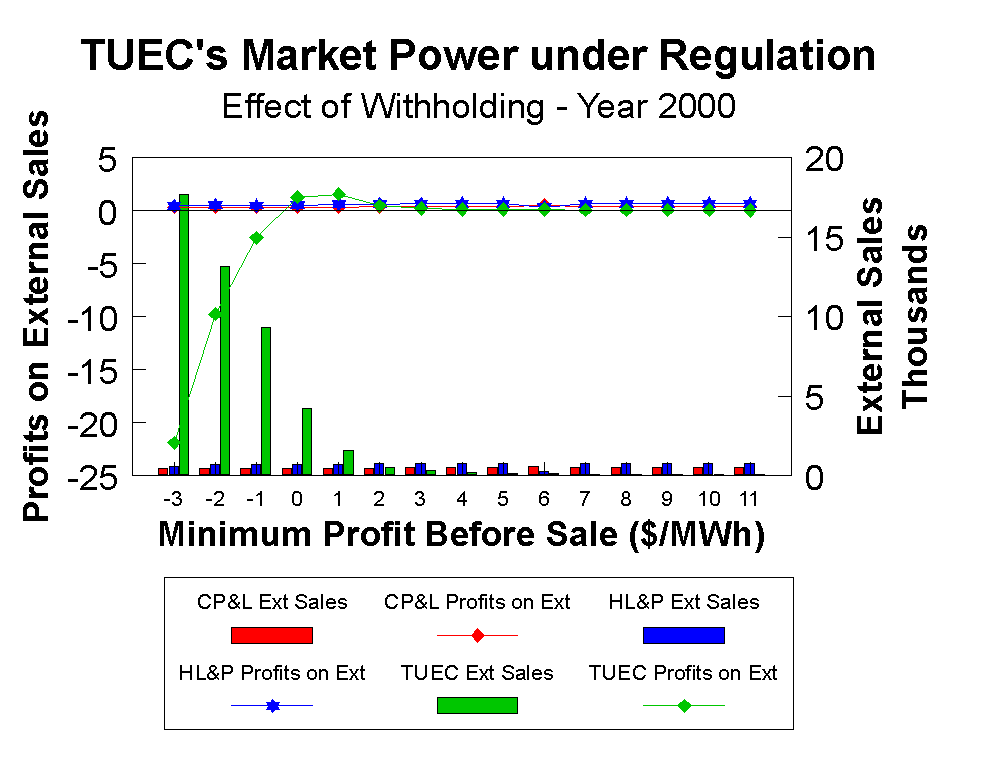
Figure 5: Effect of Texas Utilities utilizing different minimum profit before sale criteria under regulation
However, under deregulation TUEC would be able to apply the minimum profit before sale criterion to all of its sales. Therefore, it would have more influence on the market because its ability to withhold energy and demand higher prices would be much greater. Figure 6 illustrates the effect of a large TUEC GENCo. In this case, if TUEC has some surplus $20 energy, it would rather allow another company sell energy to one of its former jurisdictional customers at, say, $28 than compete and undercut its market strategy of profit maximization.
This apparent "monopolistic" pricing behavior is similar to the airline industry’s strategy of not selling seats immediately before departure to customers for the ($50 or less) variable cost of transportation. Immediately before departure, airlines would rather not sell a seat to a customer at $50, afraid to encourage the expectation that the $2200 round trip fare could be obtained for $50 if only the customer would hang around the airport waiting for an open seat. The same analogy applies to Whoppers, where Burger King can be viewed as preferring not to sell a hamburger that costs $.38 to produce (for the labor, meat, ketchup, buns, cooking heat etc.) until it gets its target price of $2.59 each.
Limits to the market power in this case again will come from the threat of new market entrants. If TUEC were to push prices too high for too long, it would invite new participants into the market, hurting long term profits.
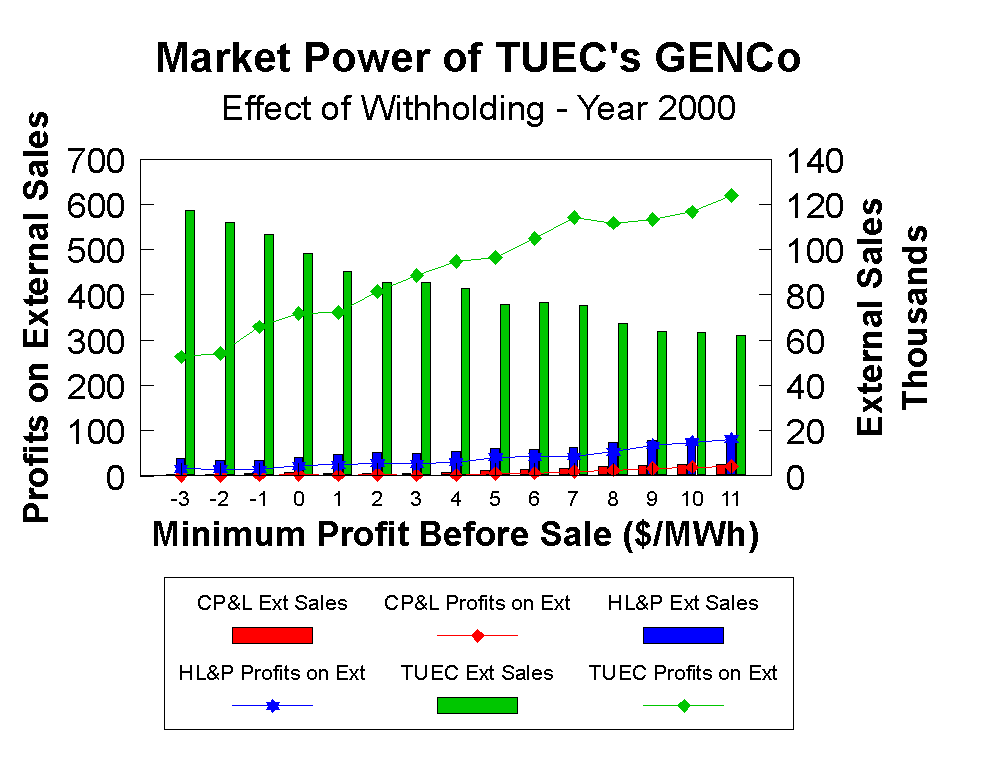
Figure 6: Effect of Texas Utilities utilizing different minimum profit before sale criteria under deregulation
Another interesting example is to analyze the effect of market power on a merged TUEC and HL&P GENCo. This new market entity would comprise 65 percent of the ERCOT market and clearly would be able to exert market power and push prices up. This ability is illustrated in Figure 7, where regardless of how high the minimum profit before sale criteria is pushed, sales do not drop off significantly.
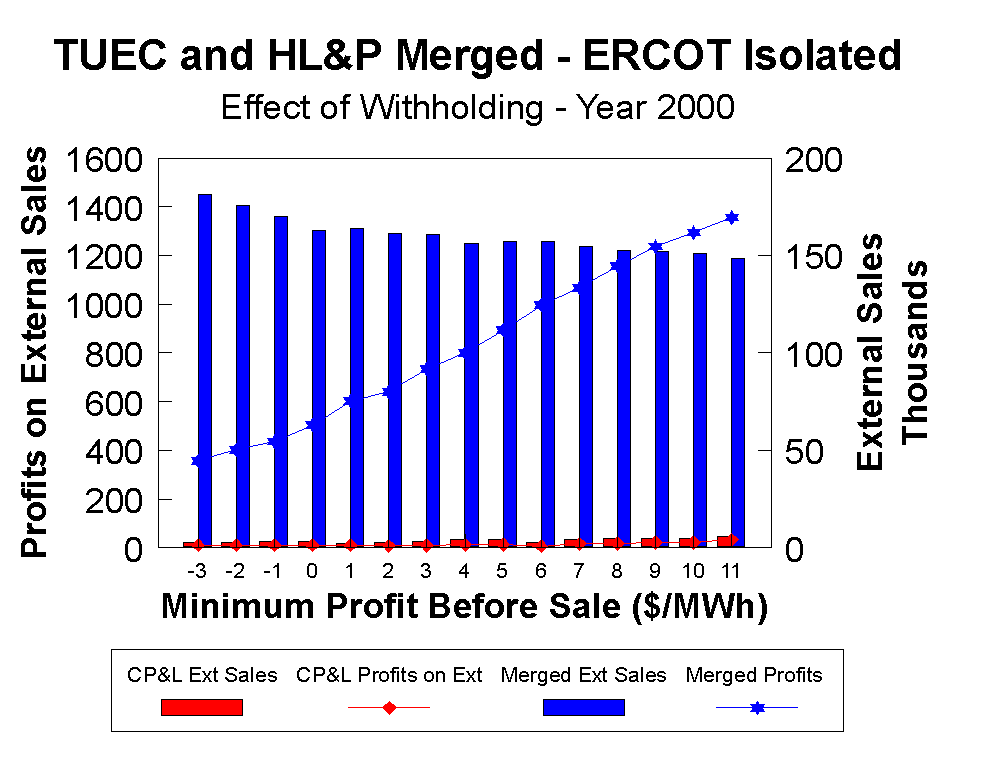
Figure 7: Effect of a merged Texas Utilities and Houston Light and Power utilizing different minimum profit before sale criteria.
Figure 8 illustrates the extent to which the merged companies could exert market power if, as part of the merger conditions, the companies were forced to interconnect solidly with the rest of the Eastern interconnection. I will speculate that ERCOT will ultimately become solidly interconnected to the East as a result of market pricing dynamics and not operational efficiencies.
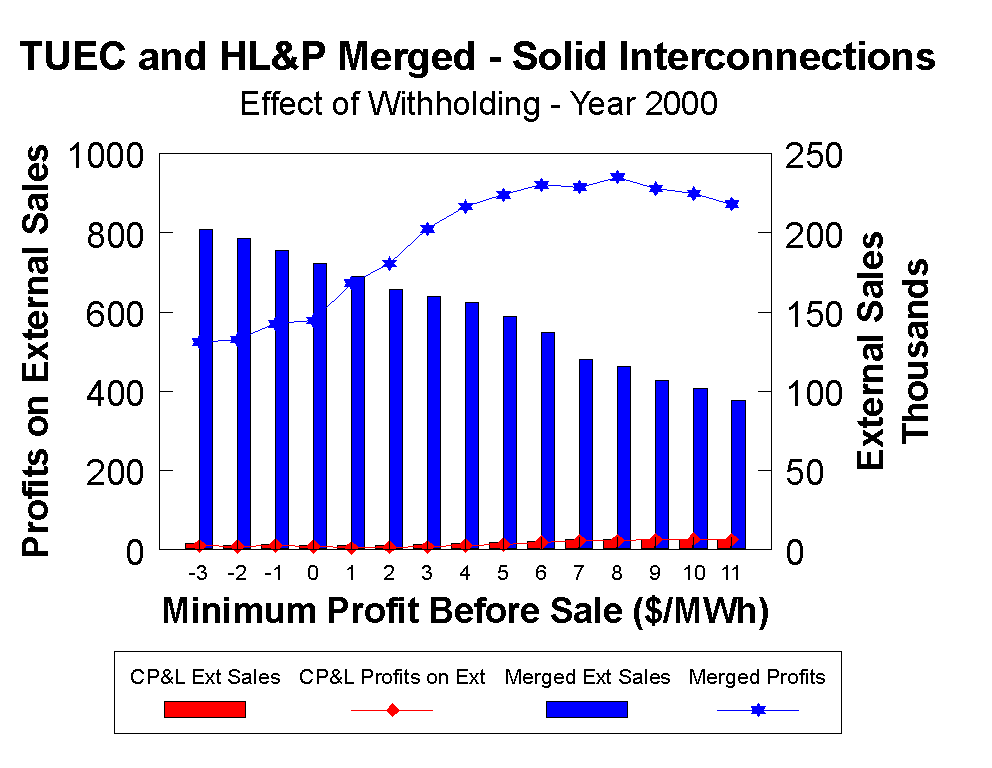
Figure 8: Effect of a merged Texas Utilities and Houston Lighting and Power utilizing different minimum profit before sale criteria under de-regulation, and forced to solidly interconnect with the rest of the East.
IV.e. Conclusions
A market participant’s ability to push prices up via increased concentration can be modeled, but the threshold for determining abusive behavior by a horizontally large generating company is unclear. Competitive markets inherently provide caps to market power, when the ability of new producers to enter the market is not restricted, and their entrance is subject only to market forces.
V. Process of Model Development and Maintenance
2) Q. Should it endorse a specific computer model? I would recommend the use of a model like the IREMM Model because it is specifically designed to analyze bulk power markets from a competitive market perspective, and to analyze the issues of concern. Given the available framework of the IREMM Model, FERC should focus on the development of further guidance on the criteria for a market power screen.
3) Q. Are there existing models that meet the requirements for use in a horizontal screen? Yes, the IREMM Model is ideal for this application. Other models that exist commercially do not seem to be suited to such broad market-based analyses. We offer our qualified view on the following models:
PROSYM/MULTISYM - a very detailed production simulation model with some ability to analyze market gaming behavior. It is complex and requires a great deal of training before developing and extracting results. It is very much a cost-based model. It is fairly expensive and probably cannot be used by FERC staff without significant staff increases, as it is resource intense. The level of detail is probably too fine and its use in hearings could distract from the key merger issues.
PROMOD/PROSCREEN - another pair of very detailed production simulation models with limited (?) ability to analyze market gaming behavior. It is a cost-based model. It is complex and requires a great deal of training before developing and extracting results. Both of these models are fairly expensive and probably cannot be used by existing FERC staff without significant staff increases, as they are resource intense. The level of detail is probably too fine and its use in hearings could distract from the key issues.
GE MAPS - this transmission planning model has a reasonable representation of the generation infrastructure. It is a very complex model and probably cannot handle the gaming issues necessary for market power analysis. It is a good tool for looking at the detailed ancillary services issues of a merger, but it probably is not a relevant horizontal market power screening tool.
IREMM - Based on the goals outlined in the Request for Comments one might supposed that FERC were specifically asking for this exact model. IREMM is a hybrid model that encompasses both generation and transmission representations. The IREMM model does not attempt to model either the generation system or the transmission system in extreme detail. The IREMM Model is capable of analyzing markets from a competitive market perspective, and it can be used readily to analyze the issues of concern to FERC. IREMM is easy to use. IREMM’s users like the fact that the results are transparent - that is, it is relatively easy to see how the results were arrived at. IREMM is a proprietary model that is available for license to anyone interested in market analyses. The additional data link with the RDI BASECASEtm product, which is widely used throughout the electric power sector, makes data handling and preparation less susceptible to "results shaping" by either applicants or interveners.
The FERC should not consider developing a model of its own. Such an activity would not be a productive use of staff time and resources. Additionally, the development of each of the models mentioned above has taken a decade or longer. The staff resource commitment for such an activity is not worthwhile. The only benefit that FERC staff would gain from developing a model itself is the ability to distribute the model and require applicants to use it.
4) Q. If the Commission were to develop a model rather than acquire an already existing model ... The FERC should not consider developing a model of its own. Comprehensive models that the FERC staff would be able to develop, test, and achieve consensus on would probably take several years to implement. Within the necessary time frame, only a highly simplified approach could be taken that probably would not address the issues that are of interest to the regulatory community. Such models would require the extensive use of heuristics and policy to formulate extensions of those policies. We believe the IREMM Model of sufficient quality for merger analysis purposes and its use would be preferable to the development of another model by FERC staff..
5) Q. How should a model be tested prior to use in specific merger cases. A model’s users should gain an understanding of how the model works, and determine if the results that it produces are reasonable. At this conceptual stage in the discussions on whether a model should be used or not used, or developed or not developed by FERC staff, there is not enough of a framework to discuss the deployment and testing criteria.
6) Q. How should a model and associated database be maintained and updated? The process of determining model modifications and enhancements would probably result from first identifying the problems associated with the analysis. A working group should be formed to define beneficial enhancements. In regards to a fixed database, it seems appropriate for the FERC to use RDI’s BASECASEtm product as the starting point for any analysis. The benefits for this arrangement are that the data come from publicly available sources and have been made consistent for application in planning analyses, which is the reason for its name, BASECASEtm. Additionally, it is a neutral and unbiased data source. It is reasonable for applicants to change the data as they see fit. Because the changes would be from a fixed, known database, the changes would be transparent and could be reviewed by all parties. If challenges arise, they could be handled as FERC usually handles differences in the facts of a case.
It is possible for the FERC staff to develop and maintain such a database. However, as with model development, database development is very time consuming and maintenance is difficult. Because of the existence of databases such as RDI’s BASECASEtm, it would appear to be a poor deployment of FERC’s resources to duplicate such an effort.
We know of no other sources of data comparable to RDI’s BASECASEtm. The only other possible competitor is the PROSYM/MULTISYM databases, but their availability throughout the industry is limited and more expensive. We would expect the PROSYM/MULTISYM databases to encounter proprietary information issues that could preclude their use in FERC proceedings.